
Dynamic Signal Analyzers – Crystal Instruments
High Channel Dynamic Signal Analyzers
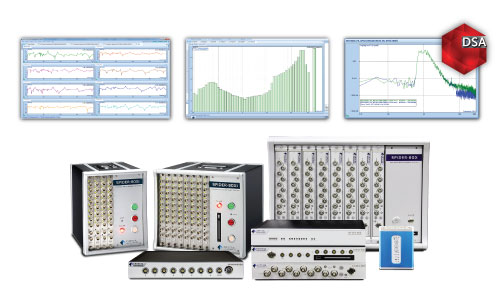
Modular System Scales up to 512 Channels
.jpg)
The Spider-80X performs FRF analysis, a function which computes the structural response to broadband excitation. An important application of dynamic signal analysis is characterizing the input-output behavior of physical systems.
Both octave filter and sound level meters are implemented based on high precision real-time filters. FFT spectral analysis, octave analysis and sound level meter analysis can be executed at the same time.
In addition to saving spectral data, the Spider-80X has the ability to record time wave form data. Raw time wave form data from an array of different sensors is displayed and recorded at sampling rates of up to 102.4 kHz.
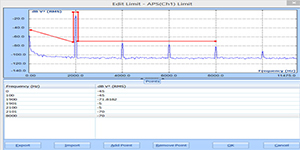
Automated limit test function allows the Spider front-end to conduct automated limit checking for time or frequency signals. The function is supported in both PC tethered mode and Black Box mode. Limiting signals are designed using the EDM software on the host PC.
Real-time digital filters are applied in the data conditioning phase. The user designs the filter model with a graphic design tool provided and uploads the filter design parameters to the front-end for real-time calculation.
Compute the SRS for all channels using maxi-max, maximum negative, and maximum positive analysis techniques. A reference profile is available.
Order Tracking is a general term describing a collection of measurement functions used for analyzing the dynamic behavior of rotating machinery for which the rotational speed can change over time. Order Tracking functions present the data against Orders of the variable shaft speed.
Sine Reduction test runs so that the Digital Signal Analyzer (DSA) is synchronized to a Vibration Control System (VCS). More processing channels are arranged on the Sine Reduction system, and work simultaneously with Sine Control through controller’s COLA output signal.
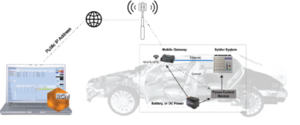
Remote Condition Monitoring (RCM) is designed for the remote monitoring of equipment or structures that are inaccessible to configure within a local network. Common applications include the monitoring of vibrations during the transportation of equipment, bridges and structures close to railways, or windmills on the ground.
The EDM Vibration Visualization feature is available for all EDM DSA (dynamic signal analyzer) software test types. This option provides fast and efficient structural model generation and full 3D visualization of the online vibration pattern on the structure under test.
Handheld & Wireless Dynamic Signal Analyzers
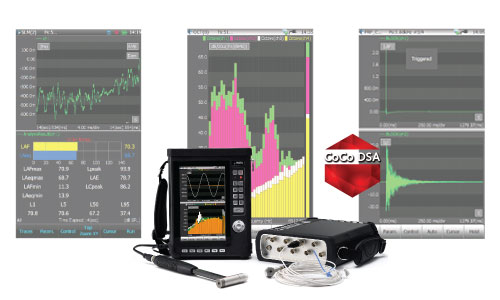
Rugged & Handheld Touchscreen Dynamic Signal Analyzers
-
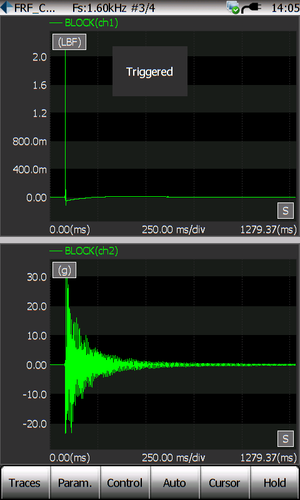 Frequency Response Function (FRF)
By utilizing the FFT technique, FRF with phase and coherence can be computed using various excitation sources, including white or pink noise. FRF can also be computed using triggered transient capture and average.
-
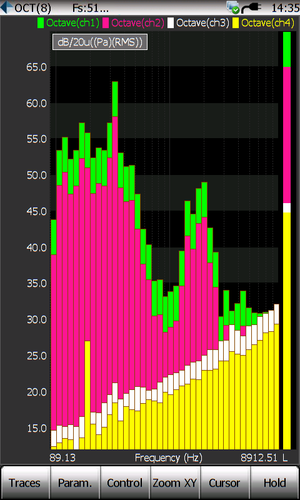 Octave Analysis & Sound Level Meters (SLM)
The CoCo has strong capabilities to compute octave analysis with real-time filters. Octave band filters are designed in accordance to ANSI S1.11 and IEC 61260 specifications.
-
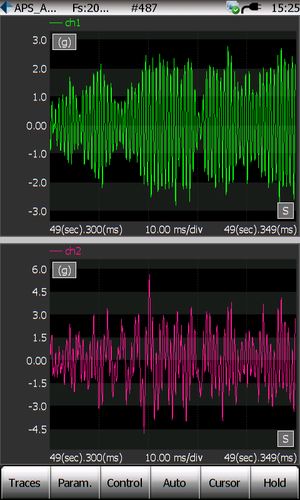 Time Waveform Recording
Supports Max Data Recording Rate up to 102.4 kHz, 8 channels simultaneously. Real-Time Spectral Bandwidth up to 46 kHz.
-
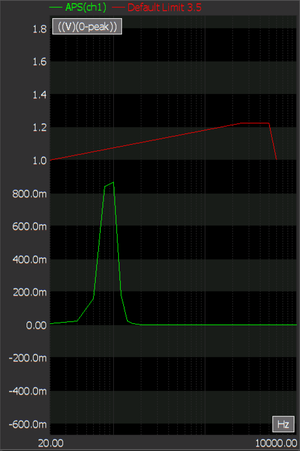 Automated Schedule and Limiting Test
The automated limit test allows engineers and technicians to set up a pass/fail measurement on any measured signal. This feature automates the process of determining whether an acquired signal meets, or is within, a given set of criteria.
-
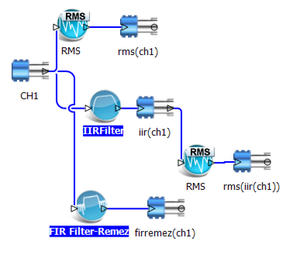 Real Time Digital Filters
The automated limit test allows engineers and technicians to set up a pass/fail measurement on any measured signal. This feature automates the process of determining whether an acquired signal meets, or is within, a given set of criteria.
-
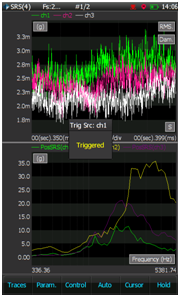 Shock Response Spectrum Analysis
Compute Shock Response Spectrum (SRS) for all channels up to 12 octave ranges using maxi-max, maximum negative, and maximum positive analysis techniques.
-
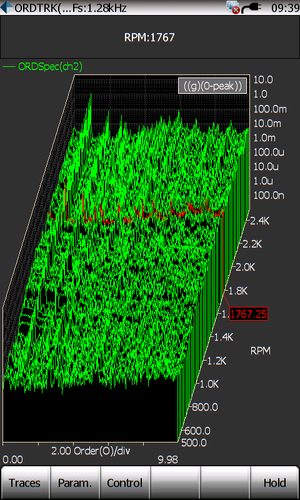 Order Tracking Analysis
Raw time streams, real-time order tracks and order spectra, narrow band RPM spectra and fixed band RPM spectra, overall RPM spectrum, and order tracks with phase relative to tachometer signals can all be measured
-
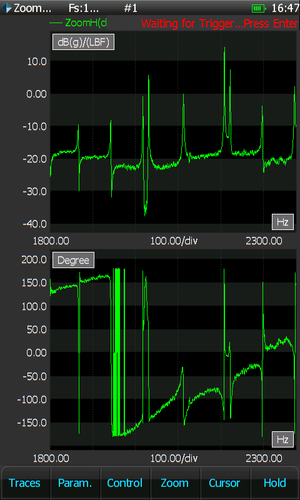 Zoom Analysis
With ZOOM spectrum analysis, the user can achieve a very high frequency resolution without computing the entire spectrum. The CoCo computes the FRF, coherence, auto power spectra and phase spectra within a user-defined ZOOM frequency band.
-
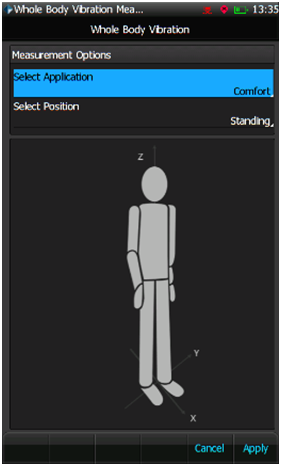 Vibration Intensity
Vibration Intensity provides analysis on 3 channels for various measurement types. Vibration Intensity includes the following measurement types: Whole Body Vibration, Hand-Arm Vibration, Building Vibration, and Ship Cabin Vibration.
*The CoCo-90 supports only Whole Body Vibration. The CoCo-80X supports all 4 measurement types -
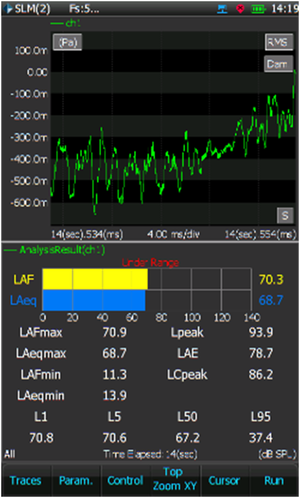 Sound Level Meter
Various sound level meter (SLM) measurements can be calculated according to the IEC and ISO standards. This function calculates time-weighted and time-averaged sound levels, in addition to peak sound level and sound exposure level.”
EDM Post Analyzer
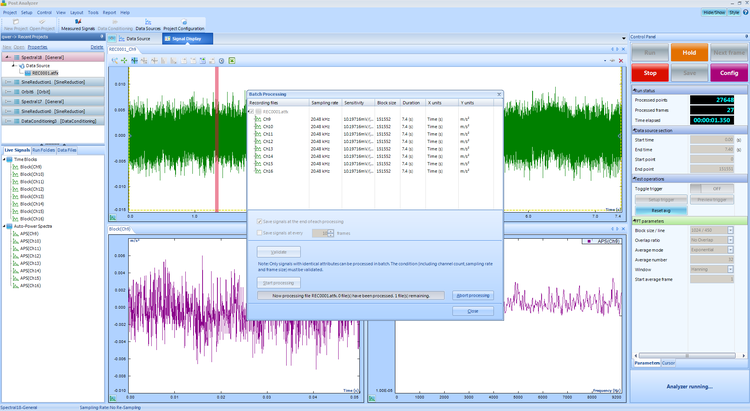
The Post Analyzer application is used for the post-processing of previously recorded time stream data. Post processing includes data conditioning, Fourier transform operations, and specialized analyses such as order tracking and octave analysis.